Title of Paper
Engineering Applications employing GIS
Technology™
Authors' Names
Constantine N. Tonias, P.E. and Elias C. Tonias,
P.E.
Abstract
As we enter the new millennium has anyone noticed how much GIS has
spread out into so many different fields; Business, Telecommunications,
Defense, Health, Homeland Security, Education and so many more. Even Engineers and Surveyors, who both have
been heavy CAD users, have incorporated GIS into their work flow. This type of diversity emphasizes the
importance of being able to integrate data with maps for the performance of
various analyses. A natural extension,
therefore, would be to incorporate the design process with GIS. If we are using GIS to pre-process (import)
base data, and post-process (update) base data, why not create all of the data
directly within GIS.
This paper addresses how civil engineering applications such as
roadway design, plan and profile drawing preparation, sewer and water
distribution systems modeling can be performed directly within the ArcGIS® environment. In so doing, the need to pass data back and
forth from CAD can be eliminated. The
paper describes how customized commands and tools were developed using Avenue
Wraps™ and ArcObjects® to bring engineering
design functionality into the ArcGIS
environment. In addition, the paper
discusses how geodatabases are utilized in the design
process. Real-life engineering projects
are presented illustrating that design and final drawing preparation can be performed
in ArcGIS.
Paper Body
1. Introduction
Civil Engineers and
Surveyors working with municipal clients are finding themselves having to
supply their clients with data that can be incorporated into the clients’ GIS
database. Many municipalities maintain
extensive and geometrically accurate databases.
As a result of this, these municipalities have a great interest in
maintaining their GIS, and as such require their contractors to provide them
project data for incorporation into their GIS.
Typically, this has entailed the engineer/surveyor to provide the
municipality with a DXF or DWG file in state plane coordinates. Generally, and rather simplistically, this
file contains the project geometry alone without any design information
attached to the geometry.
This paper discusses a
new approach in how Engineers/Surveyors can perform their work, as well as how
their project data can be supplied to their municipal clients. The new approach described in this paper
essentially involves using ArcGIS as the graphics
engine with customized commands and tools providing engineering design and
drafting functionality. Employing a
"drafting as a by-product of the design process" philosophy, a
designer should be able to tackle a project from start to end using engineering
and GIS technologies. The reason for
this type of approach is to: (a) eliminate the CAD to GIS, and vice versa
conversion and (b) take advantage of the database functionality within a GIS. In so doing, design parameters and data can
be stored in the GIS thereby adding to the "robustness" of the
GIS. In addition, the database
functionality, which is an integral component of GIS, can expedite certain
design operations, such as design specifications and take-off quantities into
an integral operation with the plan preparation.
2. Applications
As one can imagine a single project is comprised
of many different aspects; project management/coordination, geotechnical,
transportation, drainage, roads, surveying, water distribution, drawing preparation
and so forth. This paper does not
attempt to address all facets of a project, but it rather concentrates on the
surveying and roadway applications which are typically encountered in a land
development project, may it be a subdivision, shopping center, industrial
complex, a street or highway project, or most any other project that alters the
surface of a land area such as a levee, or channel project. In dealing with these applications, this
paper will address the following items:
a. Data
creation,
b. Analysis/Design,
and
c. Post-processing.
Data creation denotes the means of how data is
geometrically established, as well as, how pertinent design information is
introduced into the model. For example,
in the case of contouring, design data would include the contour interval,
heavy or index contour interval, smoothing factor, break lines and so forth.
Once the data has been created, the designer is
able to analyze the model. Continuing
with the contouring example, once the points and design data have been
established, the designer can perform the required calculations to generate the
line features representing the contours and the annotation features which
identify the contour elevations.
The post-processing item, as the name indicates,
denotes how the designer deals with the data which was created during the
analysis/design phase. In the contouring
example, once the contour strings have been developed, the designer can review
the contours for potential point elevation errors. In addition, the designer can utilize the
contour strings as a basis for extracting cross-sections and/or profiles.
The point to be made is that all three items,
data creation, analysis/design, and post-processing can be performed within the
ArcGIS environment.
3. Customized Commands / Tools
To accommodate the applications and
items described above, customized commands and tools will need to be
developed. Although offering a great
deal of functionality out of the box, ArcGIS is not a
civil engineering design/drafting system.
So that to perform civil engineering tasks, civil engineering tools are
needed. Fortunately, ArcGIS
provides an environment where developers can create their own commands and
tools.
The customized commands and tools
discussed in this paper were developed as Active X DLLs using Visual Basic®
6, ArcObjects® and Avenue Wraps™. The Active X DLLs are then added within ArcMap, thereby, providing engineering/surveying
functionality in the form of custom drop-down combo-boxes and toolbars. Examples of these combo-boxes and toolbars
appear below.
The operation of these commands and
tools were designed with the ability to take advantage of the geodatabase. The
reason for this was that a single file could be created containing various
datasets pertaining to a common application.
For example, in the case of a horizontal alignment, a file called
algX.mdb, where X denotes the horizontal alignment identification (ID), is
created. Within this geodatabase
several datasets appear representing the: (a) vertical alignment (profile), (b)
stationing, and (c) cross-sections which are associated with the horizontal
alignment. In a CAD system all of this
information would generally be stored in multiple files. Using a geodatabase,
all of this information can now be stored in a single file.
4. Topographic Mapping / Surveying
Before any project can proceed a
base map or topographic map of the project site must be established. This can be accomplished by using aerial
photography or conventional field survey means.
In either case, a digital model of the project site comprised of
contours and existing features needs to be created. In certain projects, this topographic map may
already be in existence in the client’s database, in which case the designer
may skip to the next section of this paper.
Regarding conventional field survey,
the user needs the ability to import, in mass, point data, see Figure 1. This point data typically comes from a GPS
device and is comprised of X, Y and Z values.
Augmenting this data, a point code and/or description can be
attached. This additional information
can be used to provide valuable information pertaining to the point, as well as
provide a mechanism for generating connectivity, thus facilitating the
generation of the line-work representing the existing features. For those cases in which a GPS device is not
available, a similar digital file will need be developed.
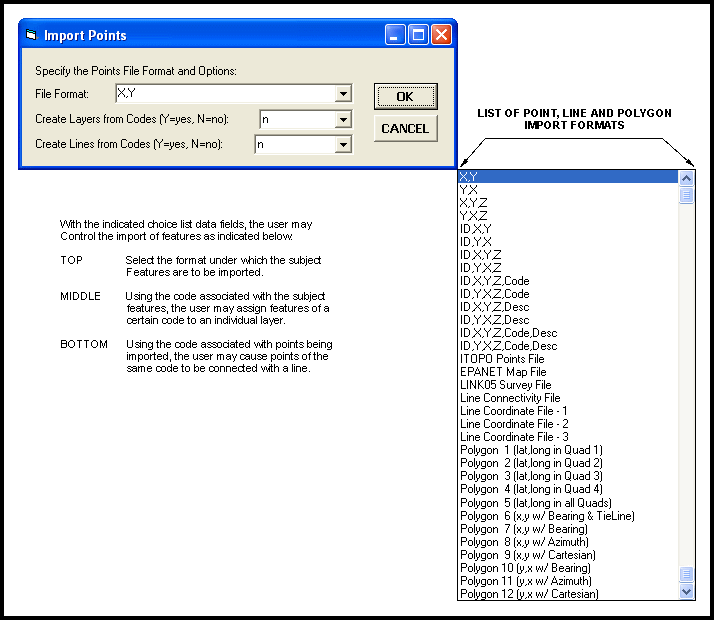
Figure 1 – Mass importing of Point or Coordinate Data
Once the point data has been
imported contours can be generated. In
creating the contours, one needs to consider the format of the point data. Specifically, does the point data represent a
radial survey such as that shown in Figure 2,
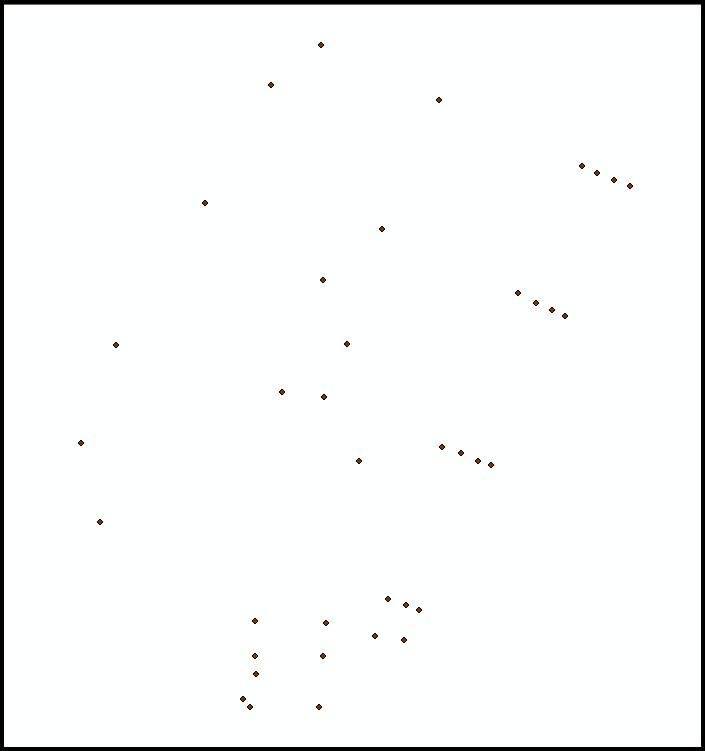
Figure 2 – Illustration of a Radial
Survey
or a
cross-sectional type of survey, as shown in Figure 3. In a cross-sectional survey, the shots are based
about a horizontal alignment, which may or may not contain horizontal
curves. In Figure 3 we simply have a
straight-line alignment with shots taken left and right of the horizontal
alignment.
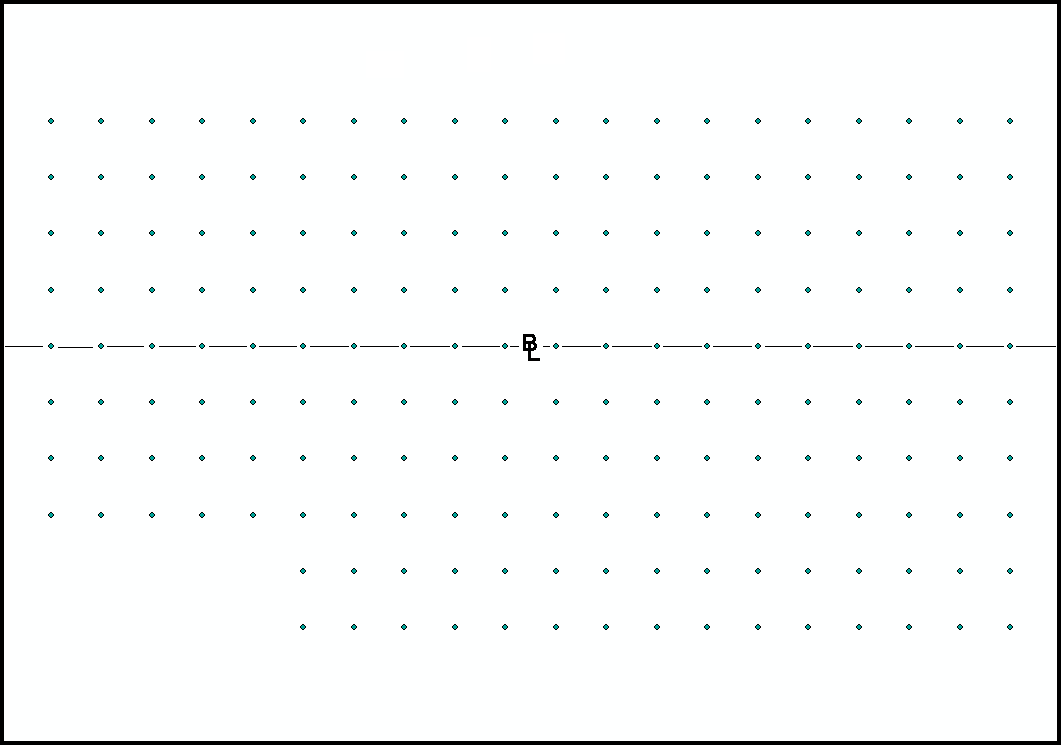
Figure 3 - Illustration of a
Cross-Sectional Survey
Depending upon the format, the user
will need to use a specific command to create the contours properly. It should be noted that conventional
contouring algorithms do not properly handle cross-sectional types of
surveys. As such, a special algorithm,
specific for cross-sectional survey data, needs to be employed.
As stated at the beginning of this paper,
when it comes to contouring the design data associated with the contours
include the contouring interval, heavy contour interval, smoothing or rounding
factor, and so on. This information can
be specified by the user at the time the contours are to be developed, see
Figure 4.
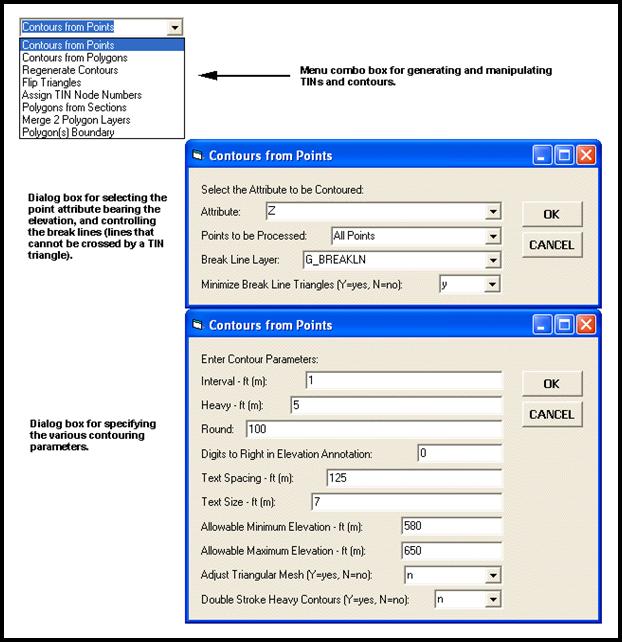
Figure 4 – Contour Generation
Multi-Input Dialog Boxes
Once the contouring parameters have been
specified, the command can proceed with the required calculations and produce
the appropriate features, see Figure 5.
Taking advantage of the geodatabase, all of
the features which are created during the contouring process are stored in a geodatabase. This
includes the lines which represent the contour strings, the annotation denoting
the elevation of the heavy contours and the polygons which form the TIN
(triangular irregular network). In
addition, the lines which represent the contour strings carry the elevation of
the contour as an attribute, and the polygons comprising the TIN are 3D
polygons (each vertex in the polygon is assigned an elevation).
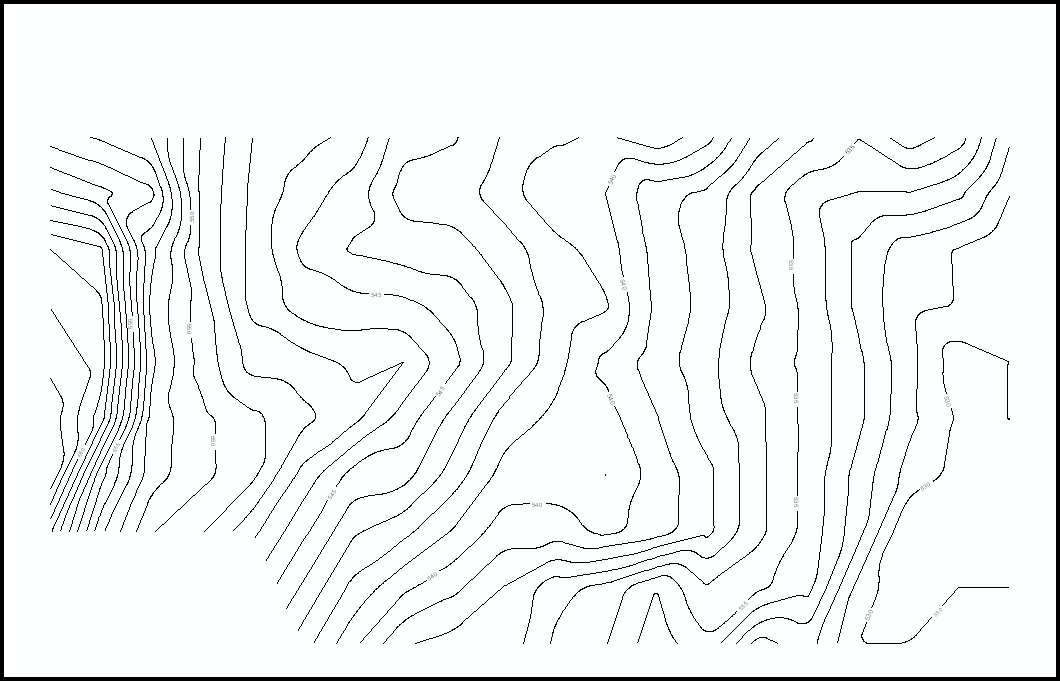
Figure 5 – Contours Created using
Cross-Sectional Survey Data
5. Roadway Design / Plan and Profile
Generation
With the topographic map
established, the engineer can proceed with the design of the roadway
system. Performing this requires the
definition of certain geometric and design information. The approach taken in performing roadway
design within ArcGIS is to store the design
information in dBase tables with an identifier, and assign to each geometric
feature that requires design information an attribute (field) containing the
specific design identifier. This enables
the designer to create a table, or rather a library of various types of design
information pertaining to various locales and types of roadways (streets,
arterials, expressways), and invoke one by its unique, user specified
identifier.
A. Design Parameters
As one can imagine there are various
types of design information. Shown in
Figure 6 is a custom drop-down box containing design information broken down
according to type of discipline. The
user upon selecting a command is presented with a dialog box containing the
Design Parameter ID field and the pertinent design parameters associated with
the design data group. All of this
information is then stored in a dBase table.
As such, this information can be easily transferred from project to
project by simply copying the appropriate dBase table, or by referencing the
table from a central location.
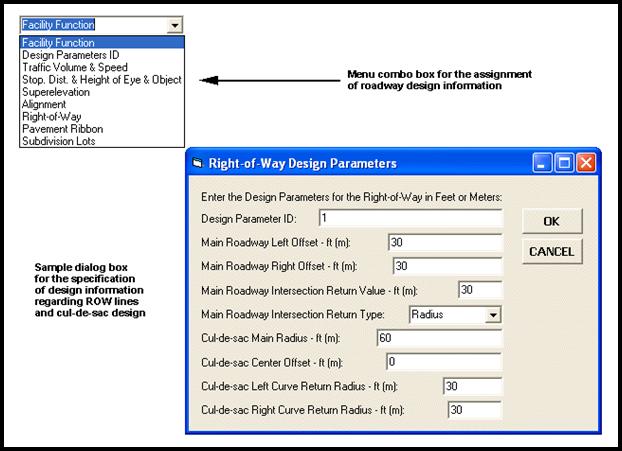
Figure 6 – Specification of the
Right-of-Way Design Parameters
B. Horizontal Alignment
The essential component in a roadway
design is the horizontal alignment or street centerline. Comprising the centerline is a series of horizontal
PI's. Each PI in the horizontal
alignment can be comprised of a back spiral length, curve radius and forward
spiral length. Shown in Figure 7 is a
street centerline comprised of two horizontal PIs, each having been assigned a
horizontal curve radius and no spiral data.
The PC and PT locations of each horizontal PI are identified, as well as
the start and end points of the horizontal alignment. In addition, the horizontal alignment can be
assigned various design parameters such as a starting station, station
increment, description and so forth.
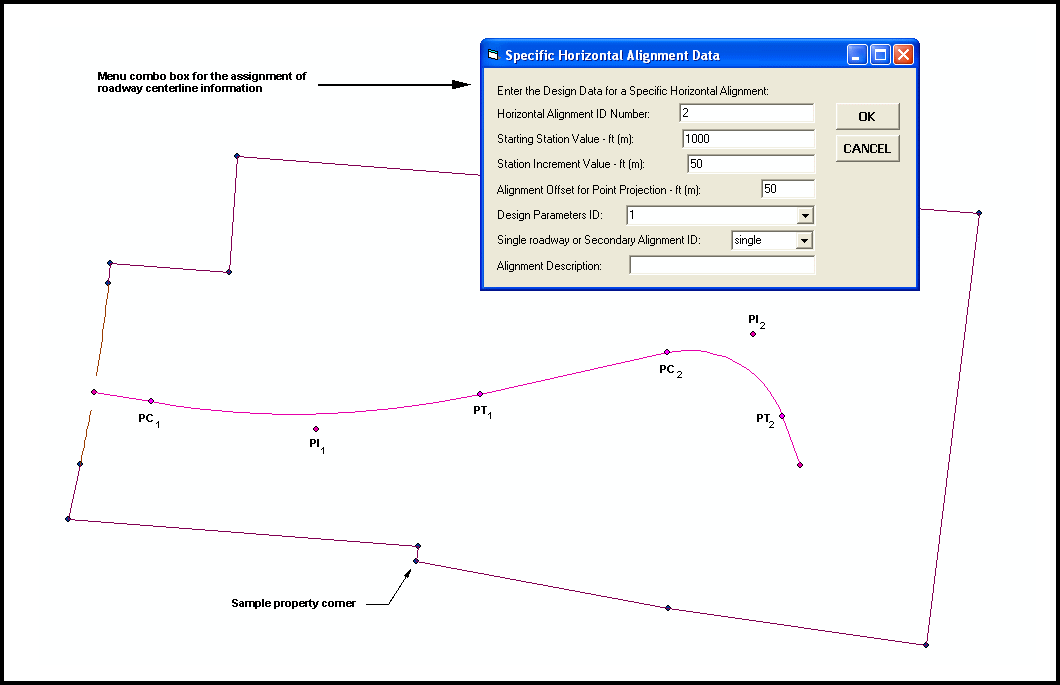
Figure 7 – Illustration of a Horizontal Alignment comprised of 2 PIs with the Multi-Input Dialog Box identifying the Design Parameters associated with the Alignment
To define the geometry of a
horizontal alignment, as shown above, one could use traditional line and curve
creation tools. It should be noted that
these tools are not terribly efficient for this type of work. As such, custom tools are required. Shown in Figure 8 is the custom drop-down box
and toolbar for manipulating horizontal alignments and performing roadway
design.
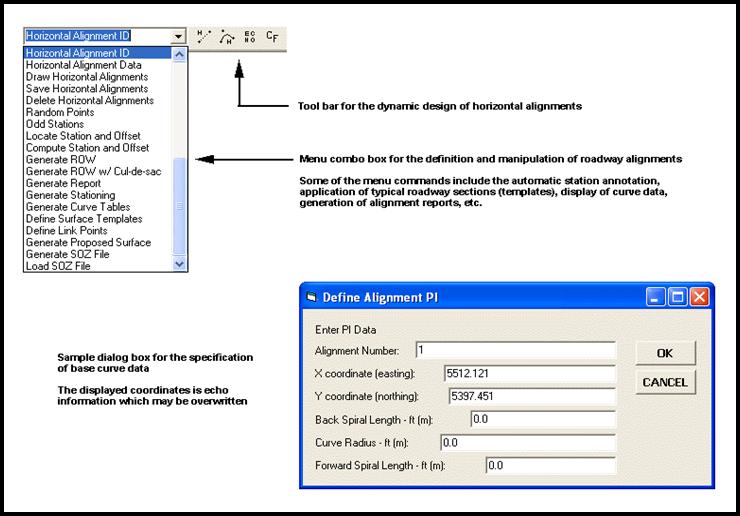
Figure 8 – Custom Commands and Tools for Manipulating Horizontal Alignments
The ![]() and
and ![]() tools enable the user to define and manipulate
the horizontal alignments start and end points, as well as the alignment’s
PIs. The dialog box shown in Figure 8 is
the base dialog box presented when a new horizontal PI is inserted. Once the horizontal alignment has been
positioned other commands can be used to post-process the horizontal
alignment. For example, Figure 9
illustrates the use of the [Generate ROW w/ Cul-de-sac] command. With this command
the user specifies a range of horizontal alignment IDs, and the associated
Design Parameter ID from which the command will generate the appropriate
right-of-way features, thus saving a tremendous amount of drafting work. This is an example of a specialized command
being created to post-process design information to efficiently create drawing
information.
tools enable the user to define and manipulate
the horizontal alignments start and end points, as well as the alignment’s
PIs. The dialog box shown in Figure 8 is
the base dialog box presented when a new horizontal PI is inserted. Once the horizontal alignment has been
positioned other commands can be used to post-process the horizontal
alignment. For example, Figure 9
illustrates the use of the [Generate ROW w/ Cul-de-sac] command. With this command
the user specifies a range of horizontal alignment IDs, and the associated
Design Parameter ID from which the command will generate the appropriate
right-of-way features, thus saving a tremendous amount of drafting work. This is an example of a specialized command
being created to post-process design information to efficiently create drawing
information.
In laying out the horizontal alignment with the ![]() tool, the user has the ability to click at a
PI, and while holding down the mouse button and moving the mouse about the
monitor screen, the alignment (tangents and curves) is continuously altered to
reflect the last position of the PI.
Releasing the mouse button freezes the alignment, at which point, the
user may terminate the editing or continue with the manipulation of the
alignment.
tool, the user has the ability to click at a
PI, and while holding down the mouse button and moving the mouse about the
monitor screen, the alignment (tangents and curves) is continuously altered to
reflect the last position of the PI.
Releasing the mouse button freezes the alignment, at which point, the
user may terminate the editing or continue with the manipulation of the
alignment.
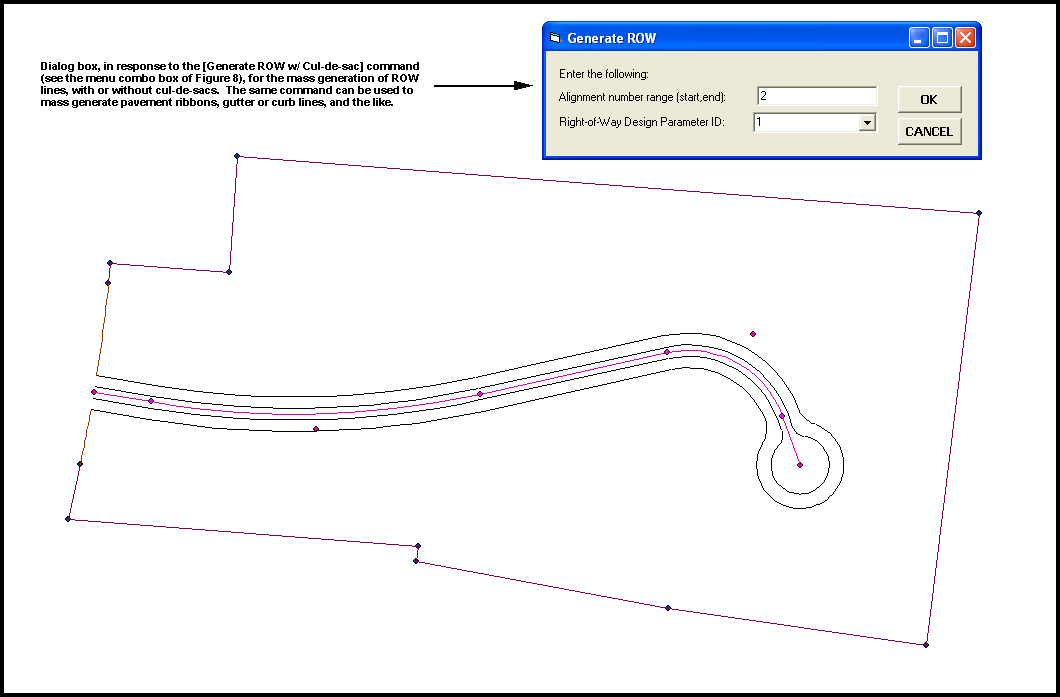
Figure 9 – Automated Generation of the
Street Right-of-Way and Pavement Ribbon Features
C. Original Ground Cross-Section and Profile Extraction
With the horizontal alignment defined, in
addition to the existing ground contours, the designer can proceed to extract
cross-sections and a profile along the street centerline. Shown in Figure 10 is a plan view of the
cross-sections that were extracted for this particular project. The interval at which the cross-sections are
extracted is controlled by the design data assigned to the horizontal
alignment, see Figure 7. When the
cross-sections are extracted, the user is able to control the extent or width
of the cross-section (left and right of the centerline), as well as, the offset
of the profile. A profile offset value
of 0.0 denotes the profile is to be taken along or on top of the horizontal
alignment.
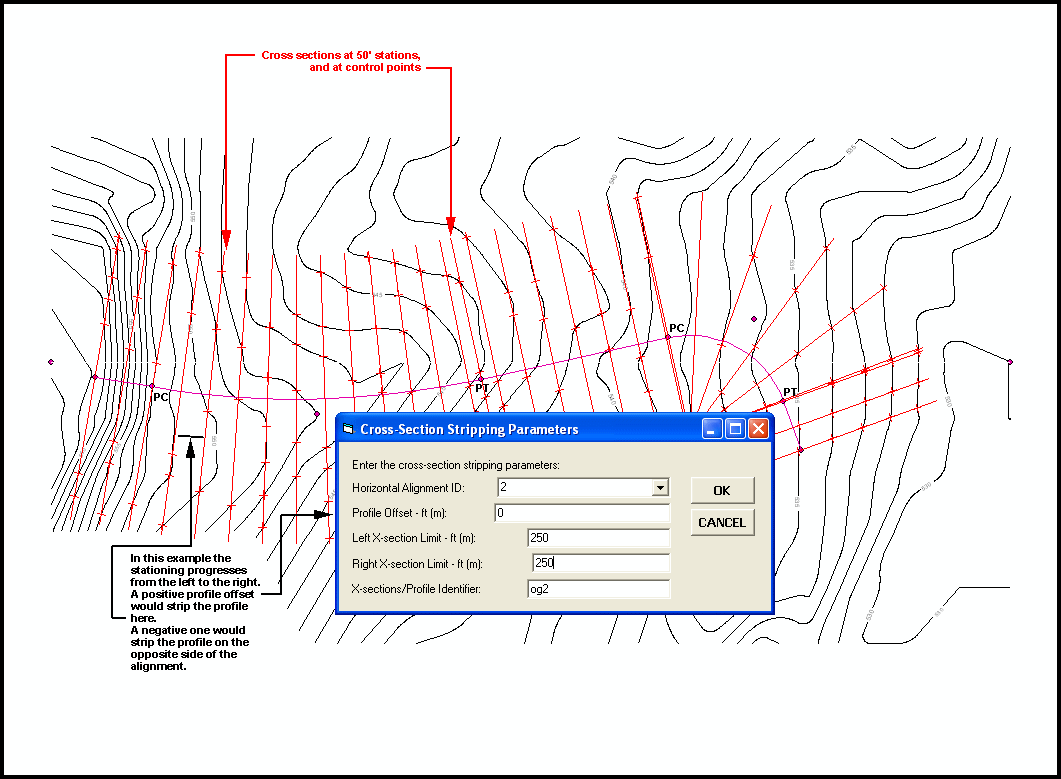
Figure 10 – Multi-Input Dialog Box for extracting Cross-sections and a Profile with respect to a Horizontal Alignment
In this particular case, the cross-sections and
profile were extracted from a set of contours.
It should be noted that the designer has also the option of extracting
cross-sections and profiles from a set of 3D polygons, or from a TIN dataset as
created with the 3D Analyst. Should the
user have cross sections obtained by conventional field operations, or stripped
during the photogrammetric compilation, these
sections could be imported.
D. Proposed Ground or Vertical Alignment Design
Continuing with the design process, the designer
can plot the original ground profile extracted above and begin to lay out the
vertical alignment associated with the street centerline. The process for doing so is very similar to
laying out the horizontal alignment with the exception that a different set of
tools are required. Shown in Figure 11
is the existing ground profile (solid black line) superimposed upon a grid
which has been created using different horizontal and vertical scales. Note that the profile grid has been
classified to display the heavy or index grid lines in a different symbol than
that of the intermediate grid lines. In
this case a darker shade of gray was used.
The magenta line represents the proposed vertical alignment.
In laying out a vertical alignment, the designer
positions the vertical points of intersections (VPIs)
and assigns a vertical curve value. The
PVC and PVT locations are computed and displayed. In addition, if there is a turning point
(TPT) on the vertical curve, this location is also displayed. Much the same way the user is able to click
at a PI of a horizontal alignment, and move the mouse to dynamically alter the
horizontal alignment, the user can employ the same methodology of dynamically
altering the shape of a vertical alignment by clicking at a PVI and moving the
mouse.
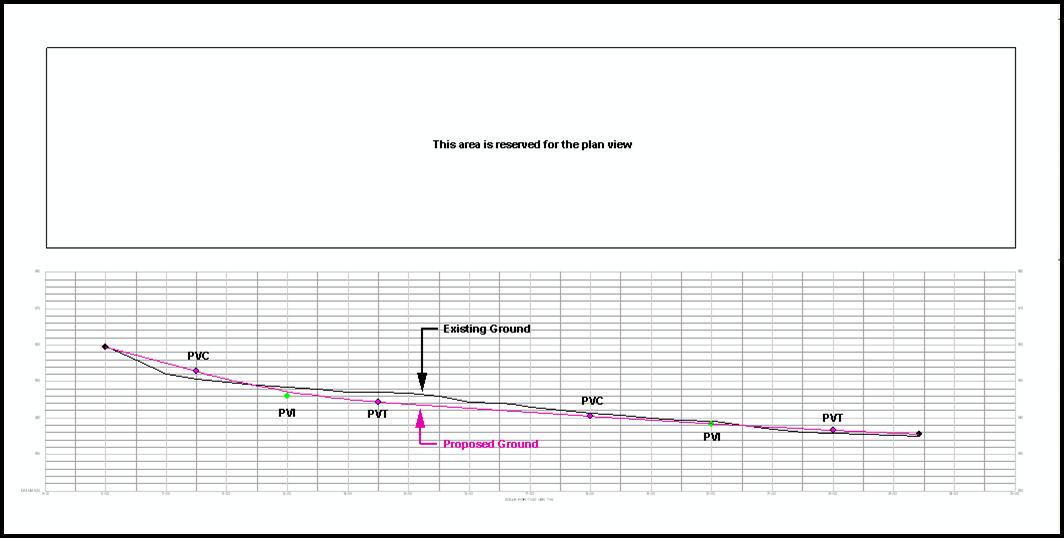
Figure 11 – Illustration of the Proposed Vertical Alignment for the Proposed Street
The custom command and tools for defining and
manipulating vertical alignments are displayed in Figure 12. Post-processing of the vertical alignment can
be done to mass generate profile annotation such as a vertical curve
table. The multi-input dialog box shown
in Figure 12 illustrates how the user can control: (a) the surface to be
processed (existing ground or proposed ground), (b) the range and increment at
which elevation values are computed, (c) the number of digits to the right of
the decimal point and (d) the size of the annotation. All of this information is used to create a
vertical curve table, whose features are stored in a personal geodatabase (algX.mdb, see Section 3 above).
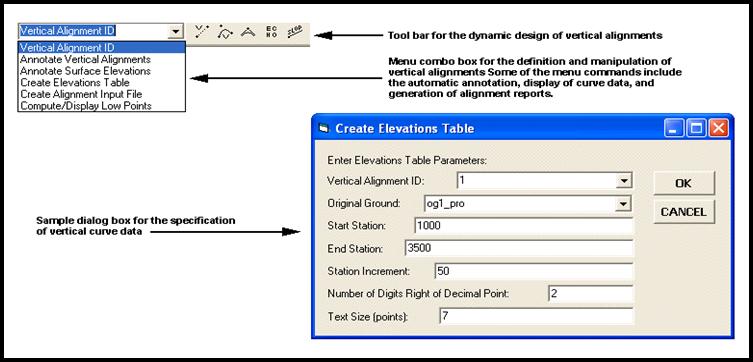
Figure 12 - Custom Commands and Tools for Manipulating Vertical Alignments
Shown in Figure 13 is a blow-up of the vertical
alignment annotation that is mass created.
All of the profile annotation shown in this figure was created by the [Annotate
Vertical Alignments]
and [Annotate
Surface Elevations]
commands shown in Figure 12. This
information is stored in a personal geodatabase and
can be repositioned or modified by the designer as may be desired.
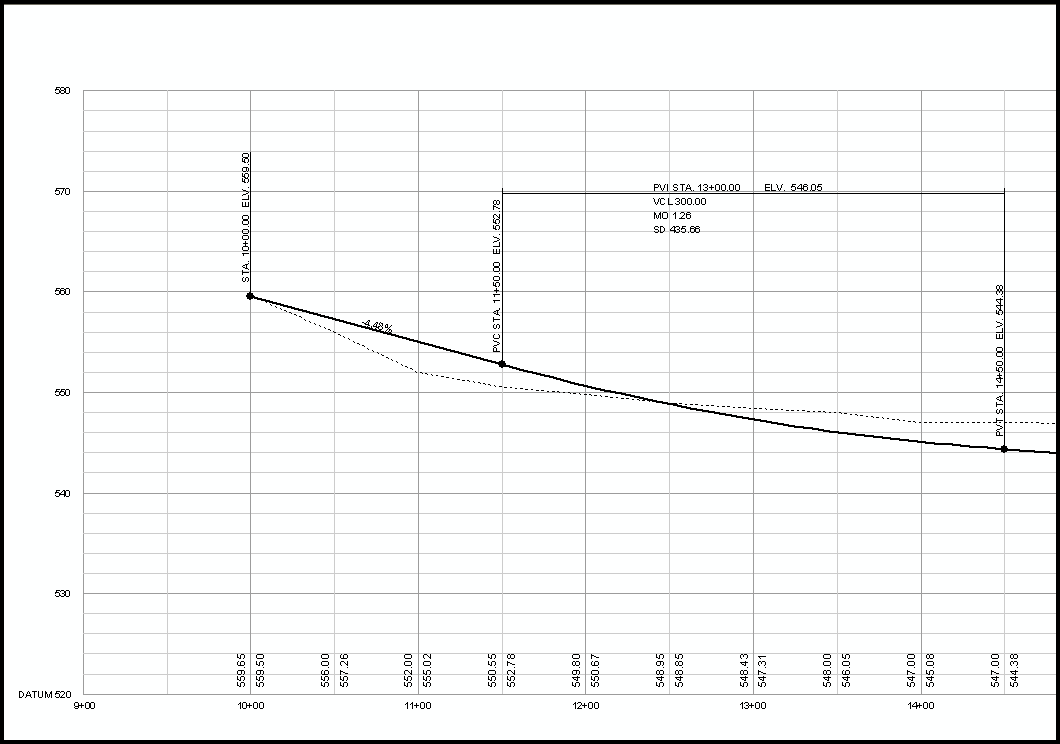
Figure 13 - Automated Generation of the Vertical Alignment Features and Annotation
E. Roadway Templates
Roadway templates can be
drafted by the designer using a custom drafting tool designed to accept slope
and distance values. Roadway templates
are assigned an ID and as with the design parameter data can be stored in a
central location for use in multiple projects.
In so doing, a company is able to establish a library of roadway
templates from which many designers can access.
A roadway may have more than one template due to the introduction of
left and right turn lanes, super elevation and other reasons. In such cases a distinct template will have to
be created for each condition, and each template will have to be assigned to
station ranges. A single template may
have to be applied to more than one such station range. Where a gradual transition between templates
is to occur, a straight line interpolation is applied for the computation of
earthwork, slope stakes and other computations.
Abrupt template changes are attained by the introduction of a very small
station range (i.e., 0.001 feet or meters).
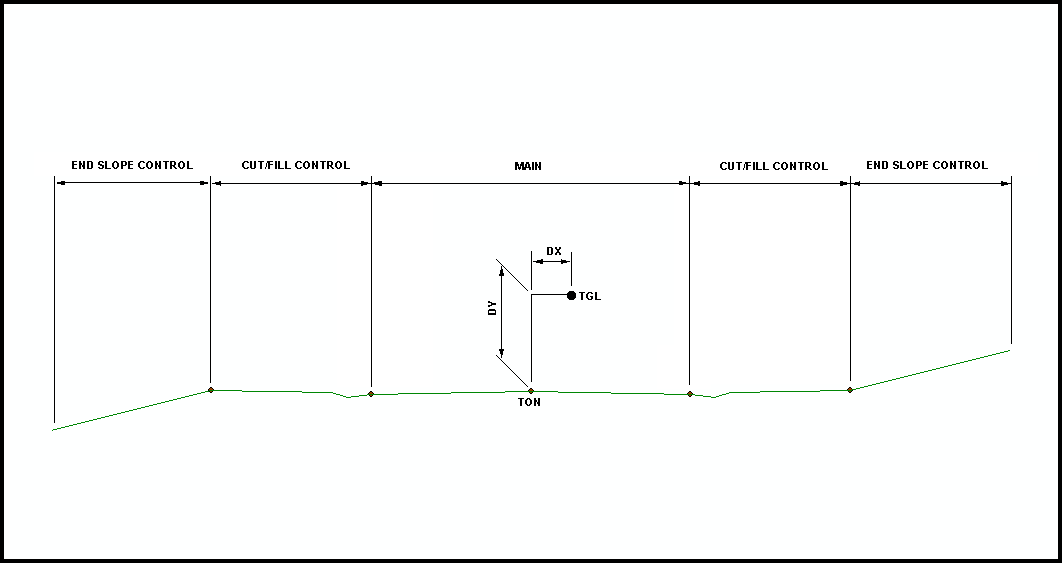
Figure 14 – Proposed Roadway Template with Gutter
F. Roadway Design – Integration of the Original Ground and
Proposed Ground Surfaces
Once the necessary components of a roadway, the
horizontal alignment, vertical alignment, original ground cross-sections, and
proposed ground templates, of the roadway have been established, the designer
may direct the program to compute earthwork and quantities, plot combined OG
and FG cross sections, and plan and profile (P&P) sheets, print
computational reports, and create a proposed ground surface which will be a set
of 3D polygons representing the roadway surface. These polygons can then be merged with the
original ground 3D polygons to form a proposed site model.
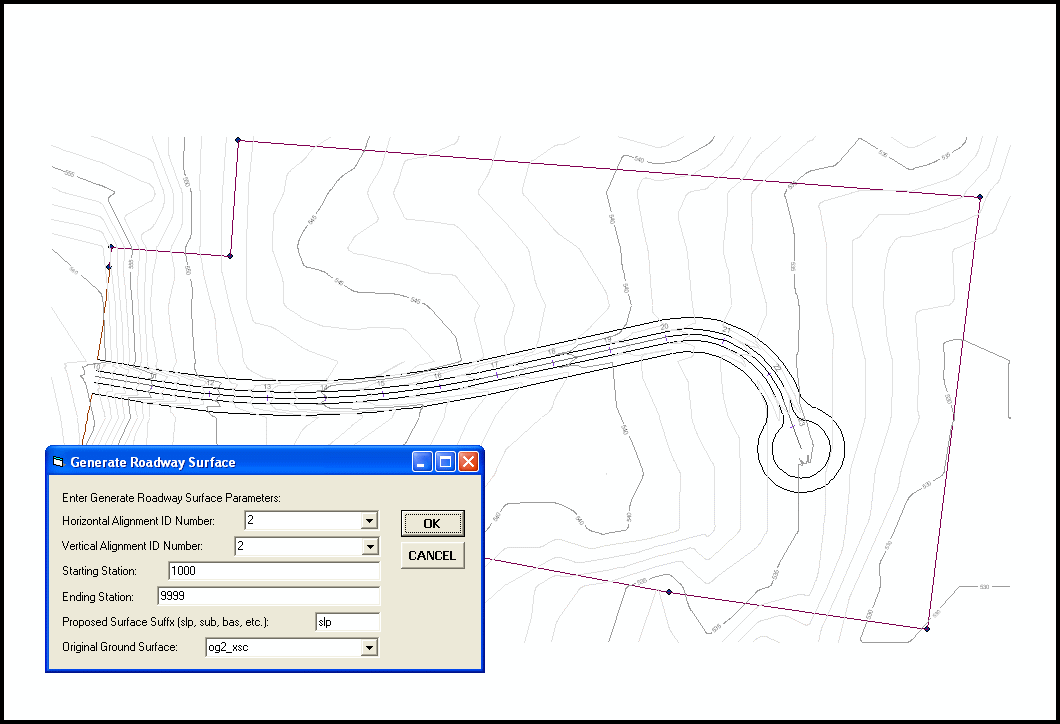
Figure 15 – Multi-Input Dialog Box for the Generation of Proposed Roadway Surface and its Integration with the Original Ground Surface
G. Cross-Section Plotting and Earthwork
As one would expect in a roadway or site
development project, the designer needs to be able to compute the amount of
earth that is to be removed or added.
Using the cross-section surfaces developed above, the [Generate
Earthwork Report] command can be employed
to prepare a formal report of the proposed cut and fill quantities.
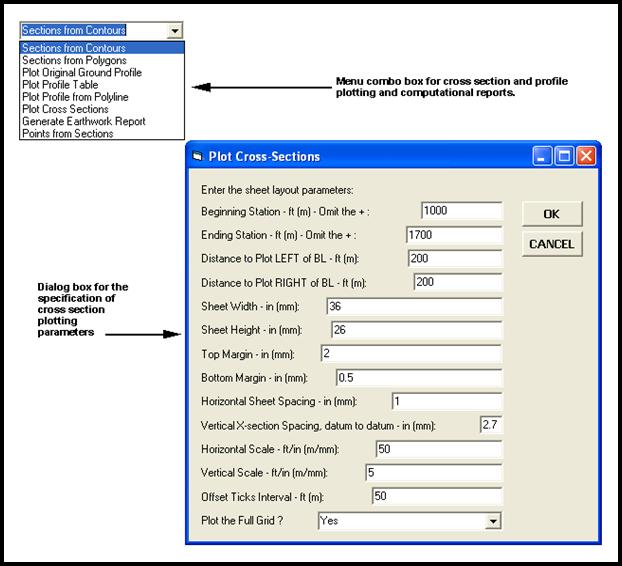
Figure 16 – Multi-Input Dialog Box for Plotting Cross-Sections
Enhancing the visualization of the proposed cut
and fill values, the [Plot Cross Sections] command is used to plot the cross-sectional
surfaces with the cross section area (S.F.) and volume (C.Y.) between the
preceding and current cross section.
Figure 17 contains a few of the cross-sections that were developed in
this project. Again all of the line-work
and annotations were mass created by the command and stored in the personal geodatabase. In
preparing the cross section sheets, the designer has the ability to control the
size of the sheet and the number of cross section columns per sheet, and the
number of cross sections per column.
Should additional cross section information need to be added, or
existing information modified, the designer is more than able to do so.
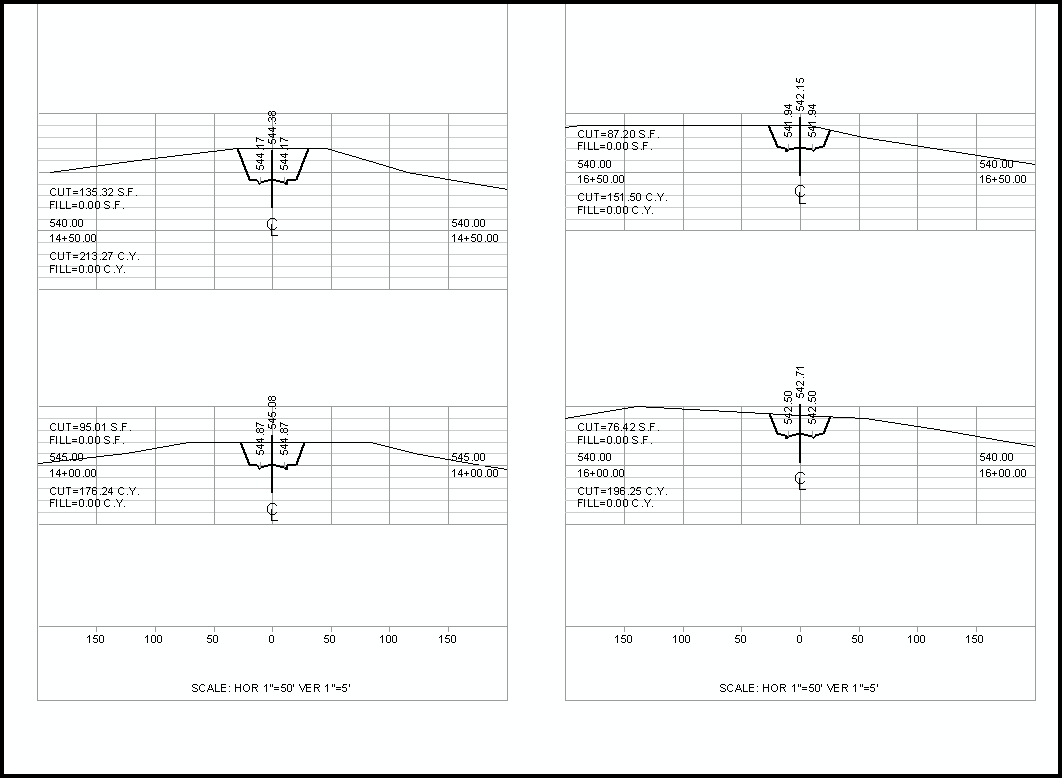
Figure 17 - Automated Generation of the
Cross-Section Features and Annotation
H. Subdivision Design
Addressing the
subdivision design aspect of a project, Figure 18 displays the custom menu
combo box commands which were created to subdivide a parcel of land. In addition, Figure 18 contains the
Subdivision Design Parameters dialog boxes illustrating the various design
parameters which the designer can control.
Note that when subdividing a parcel of land, the user can control which
design parameter ID is to be used during the computations. In so doing, the designer can try several
different scenarios very quickly by simply changing the design parameter ID
value.
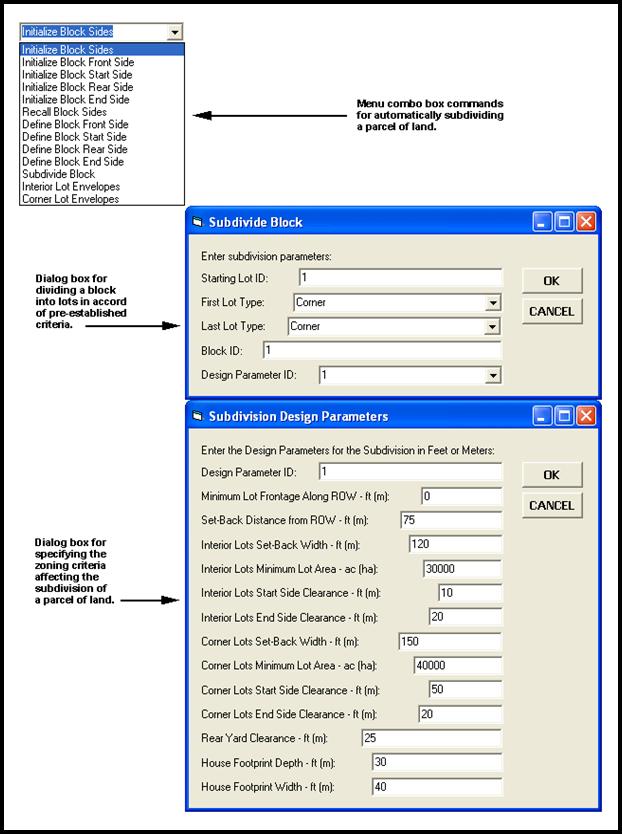
Figure 18 – Design Parameters for Subdivision Design
The basic concept in subdividing a tract of land
is that the tract of land is comprised of four sides, a front side along the street right-of-way (ROW), a start side normal to the front side at
the right end, an end side normal to
the front side at the left end, and a rear
side joining the start and end sides.
These four sides, each one of which could be comprised of a series of
lines and curves, form a block which
is assigned an ID. The [Subdivide
Block] command walks along the
front side a distance controlled by the applicable subdivision criteria, and
turns normal sides to the intersection with the rear side of the block to
define a lot. This process continues
until the end side of the block is reached.
As one can imagine there will always be an excess amount of land left
over. The designer has the option of how
to deal with this excess amount. That
is, the entire excess amount could be distributed: (a) evenly amongst all
parcels, (b) in reverse proportions to their area, or (c) only to certain
parcels in a proportionate manner. Once
the excess area has been distributed, the command displays the subdivided block
into lot polygons as shown in Figure 19.
When a large parcel of land has to be subdivided, it is first divided by
use of the various geometric commands, into blocks taking into account reserved
green or common areas. Thereafter each
block can be subdivided as indicated above.
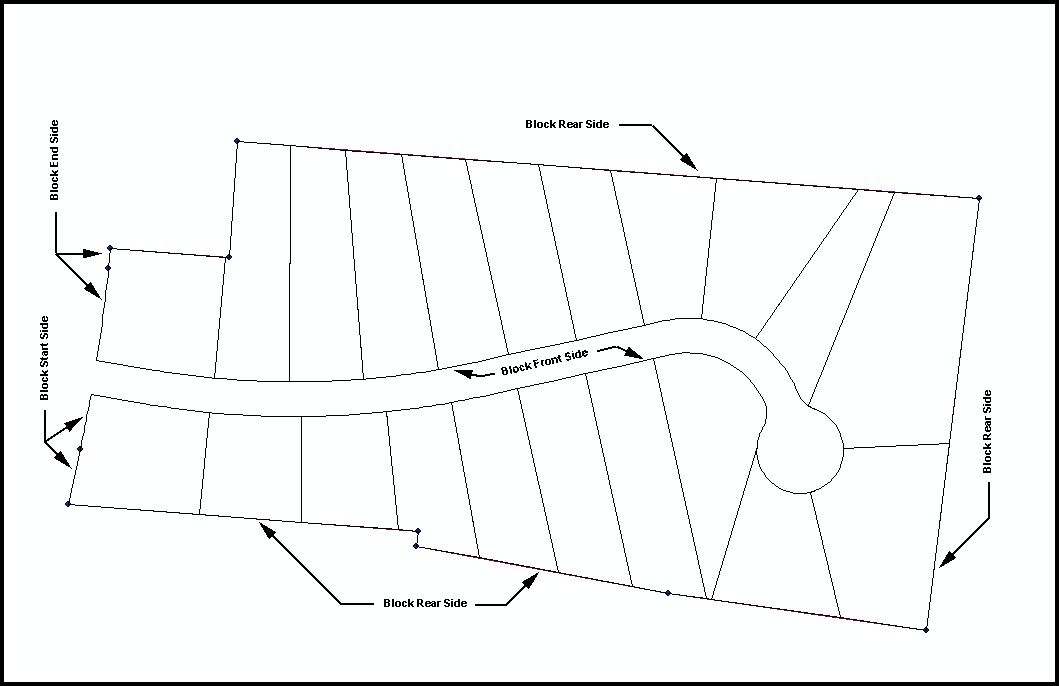
Figure 19 - Automated Generation of the
Features representing the subdivided Block
Once the lots have been created, they can be
post-processed in terms of mass annotating the bearings and distances, as well
as, creating the lot envelopes within which the buildings can be erected in
accord with the required zoning set backs and clearances. To expedite the generation of the annotation,
custom annotation commands were developed, see Figure 20. In addition, pertinent information such as lot
number, block number, house number, street name, address, etc. can be attached
to each lot as an attribute. As such,
when the lots are delivered to the municipal client, this information is
available for the client’s use and incorporation in its database.
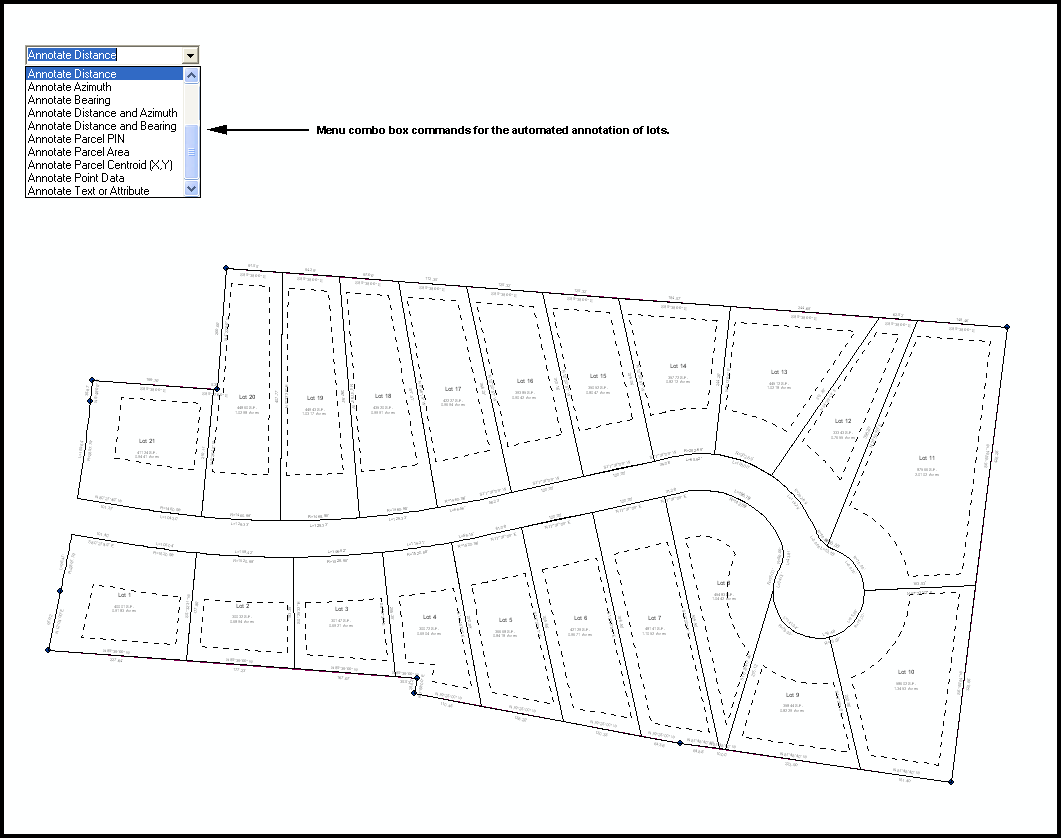
Figure 20 - Automated Generation of the
I. Plan and Profile Assembly
A required phase in the project is the creation
of the final drawings, in this case, the plan and profile (P&P)
drawings. Figure 21 contains the custom
menu combo box drop-down that was created to assist in the production of the
plan and profile drawings. In essence, a
plan and profile drawing is nothing more than multiple individual drawings put
together. For each such drawing, there
is a plan view component, a profile view component, the drawing border component, north arrow component and perhaps notes or details components. All of
these components can be generated individually.
The production of the final P&P drawing, however, can be automated
by creating a dBase table that contains the P&P sheet ID and the various
components which are to appear on the P&P.
Also contained in Figure 21 is a horizontal dialog box identifying the
components of the plan and profile drawing that are shown in Figure 22. Using the
horizontal dialog box shown in Figure 21, the designer controls the position,
scale and orientation of each component on a drawing.
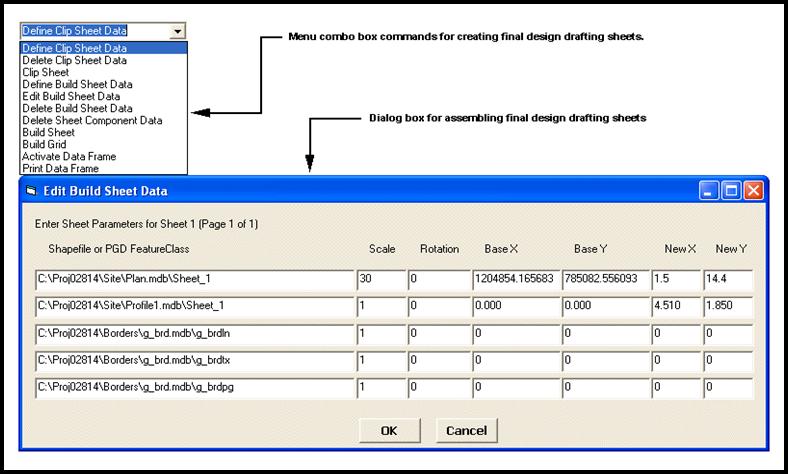
Figure 21 – Horizontal Dialog Box
identifying the Components and their Position within a P&P Drawing
In assembling or building a drawing, the [Build
Sheet] command prompts the
user to specify a range of Sheet IDs. As
such, the designer can mass produce one or many plan and profile drawings. Again taking advantage of the geodatabase, each drawing is stored in its own personal geodatabase, and is displayed in a separate data frame
within the ArcMap document file. That is to say, a single ArcMap
document file will contain multiple data frames with each P&P drawing
appearing in a separate data frame.
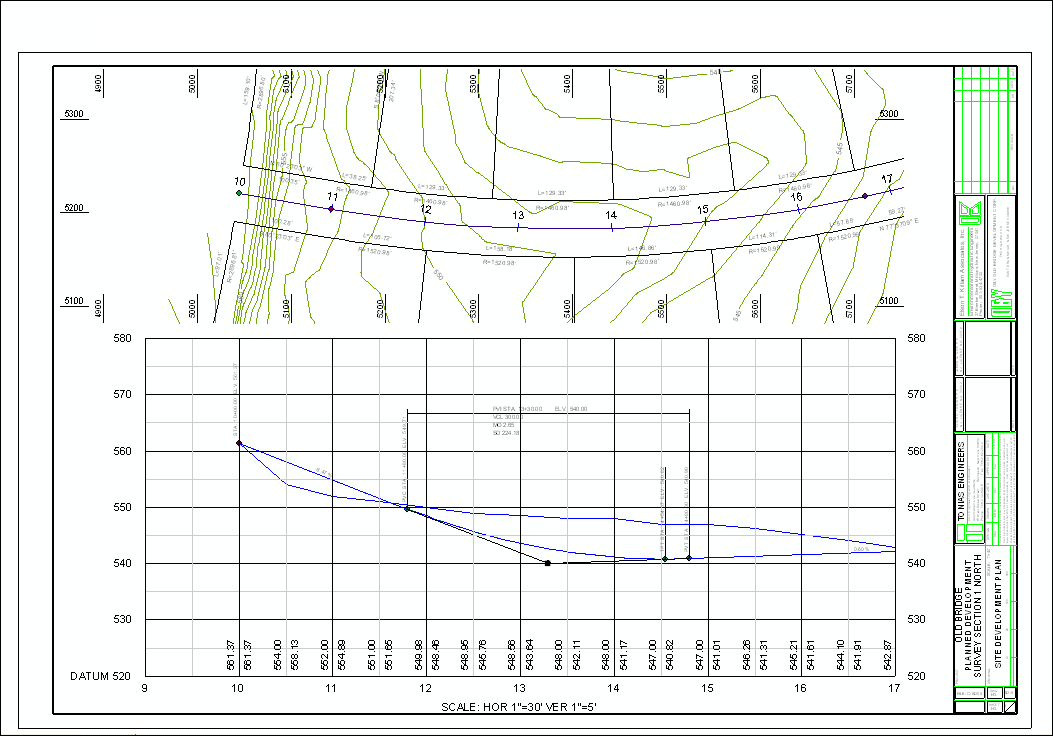
Figure 22 - Automated Generation of a P&P Drawing
J. Design Data Exchange
The design of a land
development or roadway project is an iterative process. Before its completion, there will be several
sets of preliminary, and “final design looking” sets of drawings to be reviewed
by the designer’s staff, the direct client, and the interested governmental
agencies, and in addition those NIMBY (not in my back yard) citizens who object
to most any development. For all such
reviews the 3D Analyst provides an excellent format for displaying
such a project in three dimensions from various vantage points. Thus, when the necessary components of the
design have been created, their integration can be read by the 3D Analyst to
produce the desired display renderings.
These displays can become more realistic if the above described design
products are augmented by the introduction of structures, greenery, and other
features relative to the life of the project.
Two such samples are included in Figures 23 and 24. As the design process progresses, new such
displays can easily be updated.
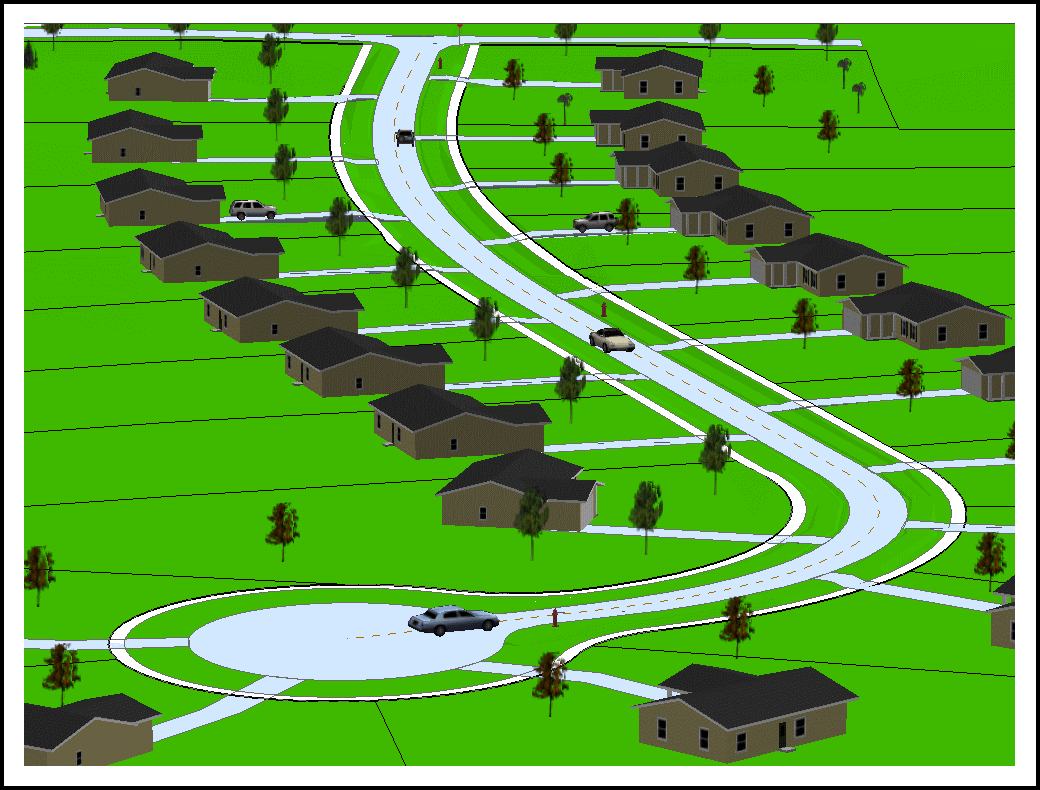
Figure 23 – 3D Analyst Rendering Looking North from the Cul-de-Sac
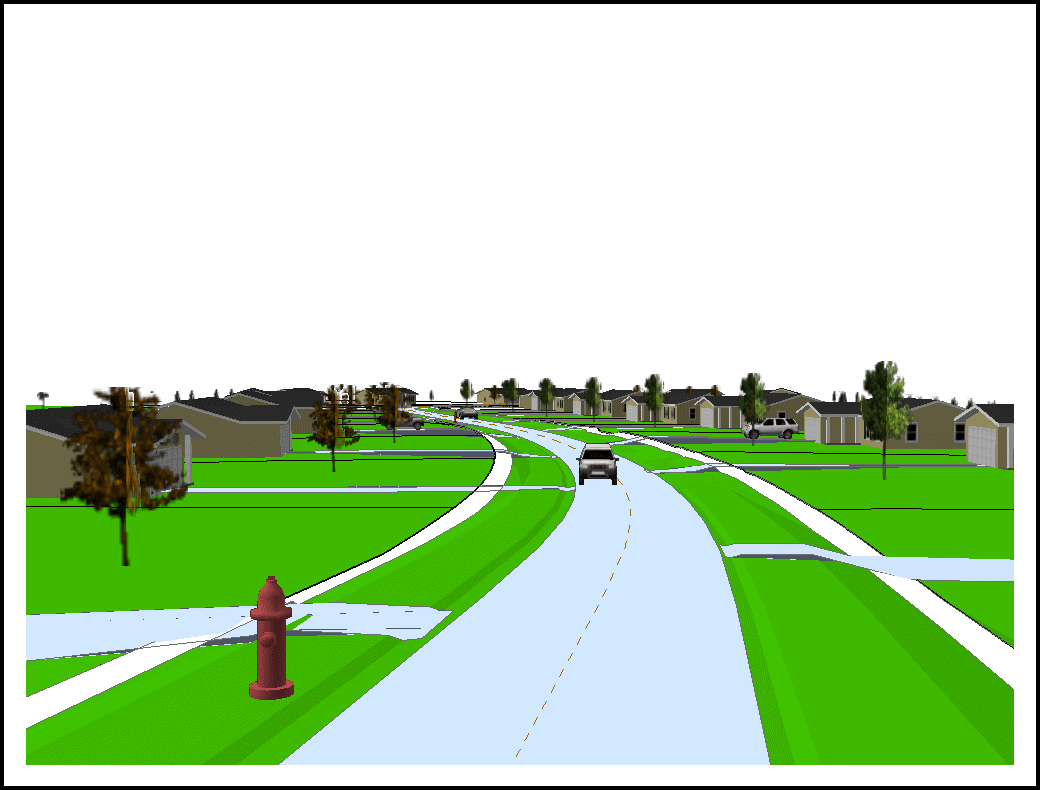
Figure 24 – 3D Analyst Rendering Looking South from the Main Entrance
As a by-product of performing the design within
the ArcGIS environment, all of the design parameters
and data are stored in dBase tables and geodatabases. Furthermore, the design data resides in a
state plane coordinate system since that was the coordinate system in which the
design was performed. As such, it is
possible to simply send to the municipal client the geodatabase
containing the requested information, without having to create some neutral
file (dxf, dwg, etc.). The requested information could include: the
contours, the subdivided lots, the design parameters, and/or any other desired
information.
In addition, as mentioned in Section H
Subdivision Design, it is possible for the designer to include in the database
information such as the lot number, house number and so forth. As such, this capability enables the designer
to assist the municipal client in maintaining their database. Therefore, it may be prudent for the designer
prior to performing the work to discuss with the client what information may or
may not be desired by the client. In so
doing, the product that is delivered to the client would be of more benefit
than just a simple DXF or DWG drawing file.
Let us acknowledge at this point that the term client above may have
been misused a bit. Although in some
places the development of a land subdivision may be undertaken by the affected
governmental agency (town, county, etc.), in most places it is the private citizen
(developer) who is the client of the engineer.
Although the engineer does not have a direct contractual agreement with
the affected governmental agency, both the developer and the engineer have to
produce a product (streets and utilities) which will be assumed by said agency
for maintenance. In a way, such agency
may be construed as a silent client who could easily dictate the state and
nature of the deliverable material. If
this silent client has a need for the easy maintenance of its GIS database, why
not deliver a product directly compatible with said database.
6. Summary
In summary, by creating custom commands and
tools, which provide specific functionality, it is possible to utilize ArcGIS as a graphics engine for most any type of
application. In addition, utilizing the
database functionality within ArcGIS enables the
designer to include pertinent design and non-graphic data. The advantage of such an approach provides
the designer the ability to deliver to the municipal client a product better
suited for integration within the client’s GIS.
Acknowledgements
The authors express their appreciation to all
those who have tested and used the components of the system, and offered
valuable information and suggestions.
Appendixes
End Notes
References
CEDRA-AVcad, CEDRA-AVcogo, CEDRA-AVparcel, CEDRA-AVland, CEDRA-AVsand and CEDRA-AVwater are
trademarks of The CEDRA Corporation, Pittsford , New York
Avenue
Wraps, 2nd Edition, July 2004, The CEDRA
Press, Pittsford
ArcGIS, ArcObjects and 3D
Analyst are trademarks of Environmental Systems Research Institute, Inc.
(ESRI), Redlands , California
Visual
Basic, Visual C++ are registered trademarks of Microsoft, Inc., Redmond , Washington
Author Information
Constantine N. Tonias,
P. E. is president of The CEDRA Corporation, and overseer of the research and
development operations of the corporation.
He has been responsible for the development of The CEDRA System, an
interactive design and drafting system particularly tailored for the civil
engineering practice, major portions of which have been ported to ArcView® GIS 3.x and ArcGIS®
8.x and 9.x. His computer experience
also includes the conversion of numerous computing programs between various
computing hardware and operating system environments.
Organization: The CEDRA Corporation
Address: 151 Sully's
Trail
Phone: 585-232-6998
Fax: 585-262-2042
E-mail: cedra@cedra.com
Elias C. Tonias, P.
E., a pioneer in the application of computers in Civil Engineering, is a
technical consultant to The CEDRA Corporation in the development of engineering
computing software. He has written
extensively in this field, and has managed the development of numerous
software. Having being involved with
software development since the very early days of the computer age, he was
forced to go through a series of program conversions from computer environment
to computer environment.
Organization: Tonias
Engineers
Address: 151 Sully's
Trail
Phone: 585-232-6995
Fax: 585-262-2042
E-mail: ect@tonias.com