CEDRA-AVlandTM
Roadway Design and Site Design
CEDRA-AVlandTM is an ArcView®
GIS and ArcGIS® extension, which includes and expands upon
CEDRA AVcadTM,
to provide the engineer functionality to perform surveying, COGO,
contouring, traverse adjustments, stakeout, road design, profiling,
cross-sections, earthwork, tax mapping and site modeling applications
in an environment that integrates Civil Engineering and GIS. A
comprehensive suite of geometric, analytical, drafting and design
commands, CEDRA AVland offers the engineer the ability to take
a project from field collection through design, construction and
facility maintenance.
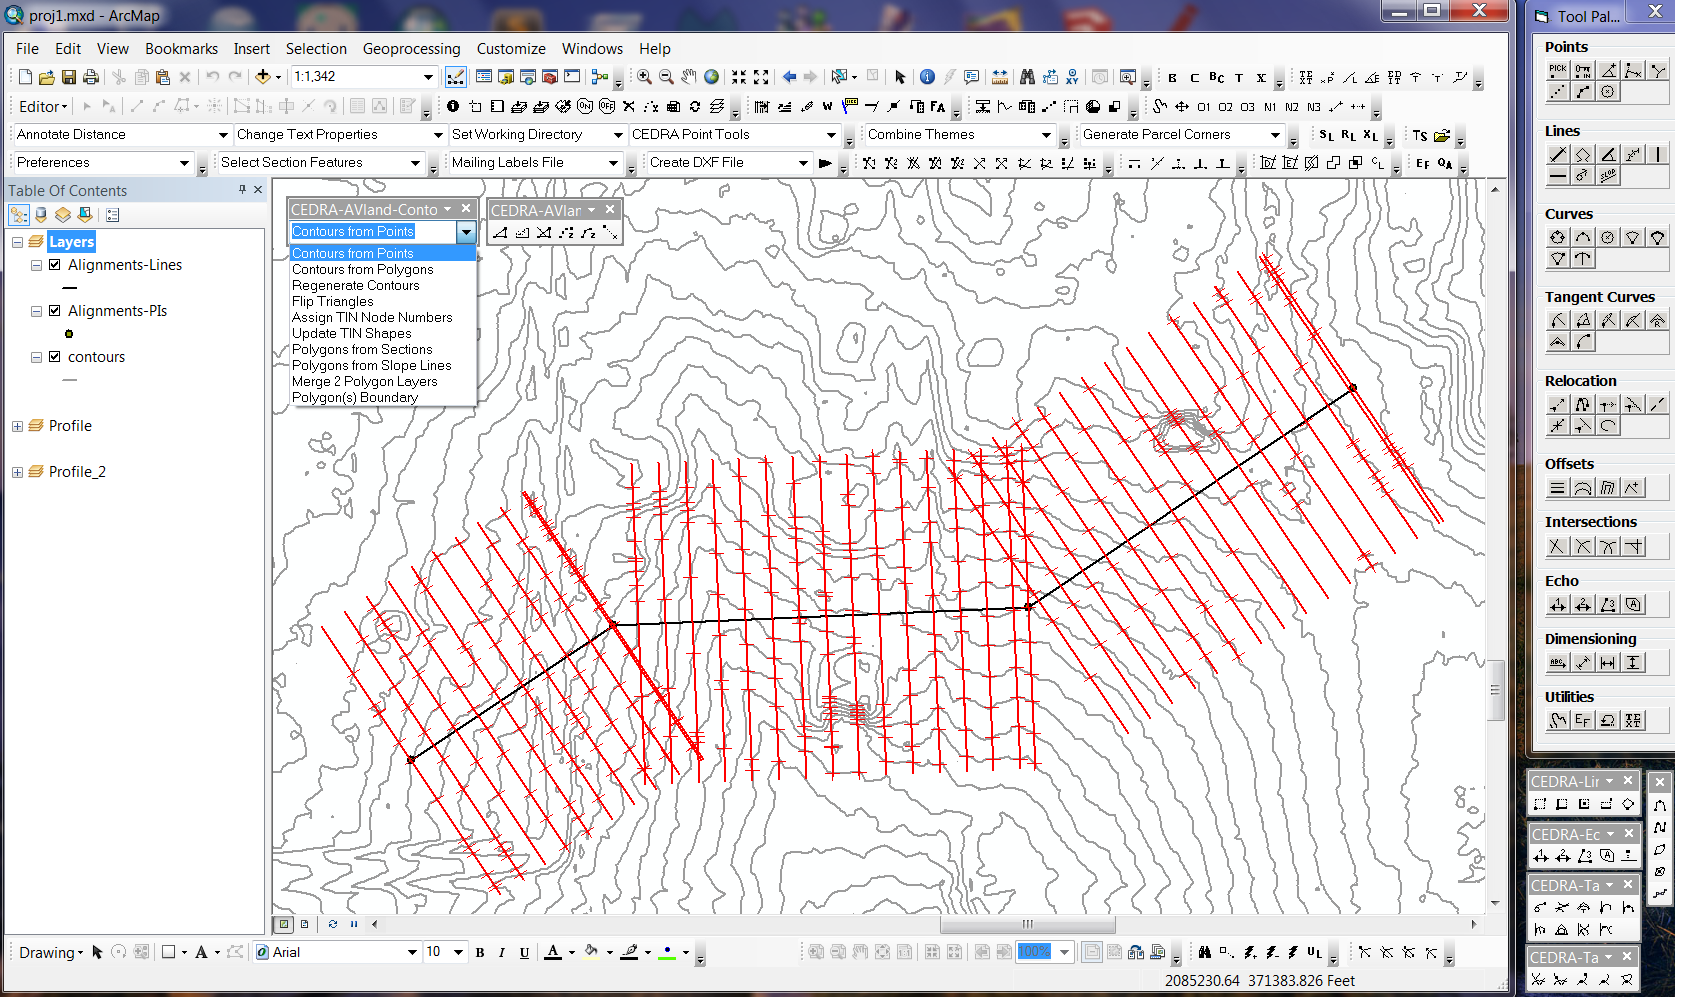
Specialized CEDRA-AVland commands enable the engineer to mass
generate fully annotated topographic maps. Once created, the GeoDatabase
technology is employed during the design process. Typical municipal
or private civil engineering projects involve street center lines,
or as commonly referred to as, alignments. Utilizing the Personal
GeoDatabase (PGD), the CEDRA-AVland software creates a PGD for
each alignment that is being designed. Within the PGD, the software
stores the horizontal geometry of the street alignment, its vertical
alignment, cross-sections, profiles, and all annotation associated
with the street center line. In addition, the information stored
in the PGD contains elevation data (Z’s). As such, ESRI's,
3D Analyst™ can be used to display three-dimensional images
of the project. Thus, the designer in a single PGD has all of
the relevant information associated with the street center line
with the individual components of the alignment being stored as
separate data sets. To download a .zip file containing a sample
ArcMap .mxd with a site layout, cross-sections, profile, as
well as plan and profile drawings right-click on the sample.mxd
link and select the Save Target As... menu item. Navigate to a
location on your PC and click the Save button to start the download.
The files should be extracted into a folder called AVland_Data
at the root level of the C: drive (in so doing the data layer
paths will be preserved).
During the design phase of a project much of the drafting, which will be included in the construction drawings, will be mass generated by CEDRA-AVland. This fact emphasises one of the guiding principles of CEDRA-AVland, that drafting is a by-product of the design. In so doing, the engineer is able to concentrate more on the design than on the generation of the construction drawings. If you are looking for a comprehensive description of the capabilities and application of the CEDRA-AVland software, click here Engineering Applications employing GIS Technology for a white paper. For a PowerPoint slide show that can be viewed in your web browser, click on this link Engineering Applications employing GIS Technology (2.35 MB).
Of particular interest to the Oil and Gas pipeline industry is CEDRA-AVland's ability to produce full annotated profiles. These profiles can be created using a table of station and elevation values, from a 3D polyline or extracted from a surface (TIN). Once generated, any of CEDRA-AVland's drafting commands can be used to modify and/or enhace the profile drawing.
In addition, CEDRA AVland provides functionality for editing attribute data using customized dialog boxes. The CEDRA-DataEditorTM extension, which is included with CEDRA AVland, enables the user to identify the specific themes and attributes which the user can edit. Quality control and data verification tools are included with the CEDRA-DataEditor extension to ensure that the database is properly maintained. The customized dialog boxes, which the user defines, are established without having the user write any Avenue, Visual Basic or other programming language software. With a simple point and click, CEDRA DataEditor users are able to edit and maintain their tabular information without having to start and stop table editing sessions.
The utilization of CEDRA AVland in conjunction with CEDRA AVsand and/or CEDRA AVwater allows the user to go beyond the site engineering aspect and include sanitary, storm sewer design/modeling and/or water distribution design/modeling all in an ArcGIS/ArcView environment.
To download a PowerPoint slide show "right-click"
on this link (3.67 MB) and select the Save Target As... menu
item. Note that you must have PowerPoint or the PowerPoint Viewer
to display the slide show. To view the slide show in your web
browser, "right-click" on this
link (6.18 MB) and select the Save Target As... menu item.
Once the appropriate file has been downloaded, simply "double-click"
on the file to start the slide show. The PowerPoint slide show
version will run on its own for approximately four minutes with
each slide appearing on its own at a designated time. The web
browser version will display notes or additional information pertaining
to the slide just below the display of the slide. Furthermore,
to advance to the next slide, in the web browser version, the
user "single-clicks" on the desired slide number which
is displayed on the left side of the application window. Both
versions of the CEDRA-AVland slide show are comprised of 27 slides.
ArcGIS users should check out the CEDRA-ArcView3-Tools toolbar. This toolbar offers a number of selection tools which will increase productivity by at least 30%. This is accomplished by reducing the number of clicks that are made in performing typical selection operations. ArcGIS users who have previously worked with ArcView GIS will definitely appreciate these tools.
To download an order form for a demo version of CEDRA-AVcad with Tutorial Manual click on the link. Once the order form has been downloaded, fill-in the requested information at the bottom of the form and then fax, e-mail or mail the order form back to The CEDRA Corporation. To see what's included in the demo version of the software click here CEDRA Demo Pack Information.
Those interested in a lot more functionality for just a little more expense should check out the CEDRA-AGsuite software package.
Click on this link for a color brochure,
which can be viewed and/or printed with Adobe Acrobat® ReaderTM.
|
|
 |
CEDRA AVlandTM
CEDRA AVlandTM is fully compatible with Versions 3.0, 3.1, 3.2 and 3.3 of ArcView® GIS and Versions 9.3, 10.0, 10.1, 10.2, 10.3, 10.4, 10.5, 10.6 and 10.7 of ArcGIS®.
AVlandTM provides the following functionality:
Surveying functionality in CEDRA AVlandTM
- Extract GIS database information representing:
- Spot points and/or,
- Contours.
- Customized point and line symbology.
- Ability to define an unlimited number of customized point codes.
- Ability to associate a specific symbol to a point code.
- Ability to import survey information in the form of:
- coordinates and elevations,
- radial survey data, and/or
- cross-sectional survey data.
- Ability to adjust open or closed traverses.
- Crandall, Compass, Transit and Least Squares adjustments with formal report generation.
- Develop contours from:
- spot points,
- cross-sectional survey data, and/or
- predefined triangular shaped polygons, or as commonly referred to as, a Triangular Irregular Network (TIN).
- Develop contours:
- at any interval.
- with the ability to specify a "smoothing" factor.
- specifying a valid elevation range.
- taking into consideration "break lines" or lines of continuity so as to bias the TIN creation.
- Ability to interpolate elevations between existing vertices on a 3D line.
- Ability to insert at a uniform spacing vertices interpolating their elevations on a 3D line.
- Ability to merge two TINs to form a new TIN.
- Ability to flip or reverse the shared edge between two triangles.
- Ability to generate a polyline representing the perimeter of a TIN.
- Produce fully annotated topographic maps.
- Ability to create a HEC-RAS GIS Import File (*.sdf) from point and line features.
Design functionality in CEDRA AVlandTM
- Includes and expands CEDRA AVcadTM and CEDRA AVcogoTM.
- Transcribe deed information using a variety of COGO commands.
- Extract cross-sections and profiles from:
- contour strings,
- 3D polygons which represent a triangular irregular network (TIN), or a
- TIN dataset as created by the 3D Analyst.
- Ability to create point features from cross-section data.
- Ability to create polyline features representing top of cut/toe of slope from proposed ground cross-section data.
- Ability to produce annotated cross-section drawings:
- superimposing up to 10 different surfaces,
- specifying desired horizontal and vertical scales,
- specifying desired starting and ending station values,
- specifying desired sheet height and width,
- specifying desired left and right offsets,
- annotating elevations at specific nodes, and
- annotating earthwork quantities, if appropriate.
- Ability to produce annotated profile drawings:
- specifying desired horizontal and vertical scales,
- specifying desired grid lower and upper datum values,
- specifying desired starting and ending station values,
- specifying desired horizontal and vertical intermediate and heavy grid line intervals,
- annotating existing and proposed ground elevations,
- annotating proposed ground vertical curve data, and
- specifying whether the profile is to be drawn in a left to right or right to left direction.
- Ability to produce an annotated profile drawing from a set
of selected point features with the
- station value coming from,
- the point's distance from the first selected point,
- the point's M value,
- the point's ID value, or
- an attribute value, and the
- elevation value coming from,
- the point's Z value,
- the point's ID value or
- an attribute value.
- station value coming from,
- Ability to produce an annotated profile drawing using a table containing STATION and ELEVATION values.
- Ability to produce an annotated profile
drawing using a 3D polyline (PolylineZM
feature) with the
- station value coming from,
- the vertex's distance along the polyline,
- the vertex M value, or
- the vertex ID value, and the
- elevation value coming from,
- the vertex Z value, or
- the vertex ID value.
- station value coming from,
- Ability to produce an annotated profile
drawing from a set of selected point features representing wells
or borings with the
- station value coming from,
- the vertex's distance along the polyline,
- the vertex M value, or
- the vertex ID value, and the
- elevation value coming from,
- the vertex Z value, or
- the vertex ID value.
- well or boring data stored as attributes with the features in the profile which can then be annotated.
- station value coming from,
- Ability to have the program identify, by station and elevation, the high (crest) and low (sag) points on a profile.
- Ability to create a vertical alignment from an ASCII file containing alignment start point, VPIs and end point defined by stations and elevations.
- Ability to specify an unlimited number of design parameters
pertaining to:
- traffic volume and speed,
- stopping distance and height of eye and object,
- superelevation,
- alignment data,
- right-of-way data,
- pavement ribbon data, and
- subdivision or zoning regulation data.
- Interactive horizontal alignment design with ability to define
PIs by:
- specifying PI coordinates,
- specifying PI back spiral length, curve radius and forward spiral length,
- picking the PI tangent point,
- picking a point the horizontal curve passes through,
- entering the horzontal curve tangent distance, and by
- entering the PT to PC distance, with the option of either:
- maintaining the radii of the PIs being processed, or
- changing the radii of the PIs being processed.
- Ability to create a point along a horizontal alignment by specifying a station value and an offset distance.
- Ability to project a set of selected point features upon
a horizontal alignment and compute the station and offset of
a point with the ability to:
- store the alignment number, station value and offset in the point's attribute table, and/or
- create a report (formal or comma delineated) containing the
following:
- X and Y coordinates,
- station and offset values,
- point number,
- point elevation, and
- point description
- Interactive vertical alignment design with ability to define
PVIs by:
- specifying PVI station and elevation,
- specifying PVI vertical curve length,
- picking a point the vertical curve passes through,
- specifying the back distance and slope, and by
- specifying the forward distance and slope.
- Introduce random points and odd stations into a horizontal alignment.
- Generate pavement ribbons and right-of way features from design data.
- Generate alignment reports containing stationing, coordinates, deflections, etc.
- Create an unlimited number of proposed ground templates.
- Compute earthwork quantities accounting for shrinkage, swell and muck.
- Automatic subdivision of land blocks per zoning regulations.
- Create house envelopes.
Drawing Preparation
- Mass annotation of:
- horizontal alignment stationing with the ability to control
the:
- size of the annotation,
- interval of the annotation,
- which station ticks are to be shown,
- size of the station ticks, and
- offset of the annotation from the station ticks.
- horizontal curve tables for specific or all PIs with the ability to specific which curve parameters are to be annotated.
- horizontal curve tables for pipeline stakeout.
- vertical alignment data including:
- station,
- elevation,
- back and forward grades,
- turning point (crest and sag) locations,
- vertical curve length,
- mid-ordinate, and
- site distance.
- existing and proposed ground elevations:
- on the profile, or
- in tabular form.
- horizontal alignment stationing with the ability to control
the:
- Ability to convert raw station values (1000.00, 1250.75,
1500.00, etc.) into an engineering format (10+00, 10+00.00, etc.)
by specifying:
- the field containing the raw station values,
- the field to contain the formatted station values,
- a prefix and/or suffix to be included in the formatted station value, and
- the number of digits to the right of the decimal point, if any are to be included.
- Annotated plan and profile drawings
(click on the link to see a sample) with the ability to:
- clip feature layers maintaining the layer's symbology (color, classification, etc.),
- clip raster layers,
- have the clip window (original) oriented at any angle (after clipping). In the original there are two clip windows defined. After clipping, it can be seen that the data within the clip widows has been cut-out from the original, while maintaining the original orientation of the image. Note that it is possible for the user to rotate, translate and scale the clipped images as desired, and
- mass generate clip windows along a selected polyline feature.
- Creation of Special Plane Curves
with the ability to create:
- Archimedes, Fermet, Reciprocal and Lituus spirals, and
- control the spiral:
- smoothness or increment angle,
- bandwidth,
- radius, and
- starting angle.
Interface with ArcGIS 3D Analyst
- CEDRA AVland TINs can be directly imported into ArcGIS 3D Analyst.
- The ROT attribute within CEDRA AVland created layers can be used to properly orient 3D symbols.
Importing functionality
- dBase, Info, SDE and ASCII files may be directly read.
- Access, Paradox, FoxPro, Oracle, Sybase, Informix, DB2, Ingres
by:
- Exporting to dBase or ASCII for direct reading or,
- accessing through ODBC - Open Database Connectivity.
- any ODBC/SQL-compliant database.
- Import of PC Arc/Info coverages, Arc/Info coverages and libraries.
- Direct reading of Shapefiles.
- DXF, DWG, DGN and CEDRA CAD drawings.
- VPF, MapInfo, Atlas GIS and ASCII map data.
- LAND XML (alignments, parcels, points, TIN).
- Ability to have comments within the ASCII files that are processed for mass importing.
- Ability to mass import polygons from an ASCII file.
- Ability to mass import points in a variety of formats from an ASCII file.
- Ability to mass import lines that are defined by node numbers from an ASCII file.
- Ability to mass import polylines that are defined by a line ID value and vertex coordinates from an ASCII file.
- Ability to import a CEDRA "COGO" file which is
an ASCII file that allows the user to mass import:
- Lines given a direction and a distance.
- Polygons given a direction and a distance for each course (side) comprising the polygon. The polygons may also contain curves (simple, compound and reverse) rather than just straight line sides.
- Non-Tangent Curves given a chord direction, a chord length and a radius.
- Tangent Curves given a chord length and a radius.
- Tangent Curves given an arc length and a radius.
- Tangent Curves given a central angle and a radius.
- Ability to display the following raster file formats:
- TIFF (.tif files).
- ERDAS (Rev 7.3 and 7.4 .lan and .gis files).
- IMAGINE (.img files).
- BSQ, BIL and BIP.
- Sun Rasterfiles (.rs, .ras, and .sun files).
- BMP.
- JPEG (.jpg files).
- IMAGINE (.img files).
- Arc/Info GRID.
- RLC (Run-Length Compressed format).
Exporting functionality
- Ability to export features (points,
lines, polygons and annotation) as an Arc/Info Generate File.
- In the form of a single Generate file, or
- As multiple Generate files using the layer name as the name of the file.
- Ability to export features (points,
lines and polygons) in the form of a Vertex Coordinate File.
- In the form of X,Y coordinates,
- In the form of North,East coordinates,
- In the form of Longitude,Latitude coordinates, or
- In the form of Latitude,Longitude coordinates.
- Ability to export features (points, and multi-points) in a variety of ASCII based formats.
- Ability to export features (points, lines, polygons and annotation) in the form of a DXF File.
- Ability to export features (polylines and polygons) adhering to the Traverse File Format.
- Ability to export alignments, CEDRA TIN and contours to a LandXML file.
Graphic display manipulation
- Mass Annotation of lot identification numbers, metes and bounds, and areas.
- Advance or return to previous views.
- Ability to save and assign a name to an unlimited number of views.
- Ability to return to a previous view by specifying a view name.
- Ability to zoom in or out of a view by specifying a scale factor.
- Individual and global text scaling.
- Individual and global text editing.
- Viewing of ASCII based files.
- Customized selection tools for ArcGIS users.
- Ability to modify a specific attribute of one or more graphic text elements without altering any of their other attributes.
|
|
 |
|
|
 |
|
|
 |
|
|
 |
|
|
 |
Printing Capability for ArcGIS
ArcGIS® users have the ability to print the active data
frame using the Print Data Frame command, which is available in
the CEDRA-DataFrame-Tools toolbar. The Print Data Frame command
differs from conventional ArcGIS printing in that the user is
able to control: (a) the map scale, (b) the map area to be printed,
(c) the location of the map on the paper and (d) optionally, whether
a data frame, which contains a map sheet border, should be included
or not in the map.
As most ArcMap users have realized, within an ArcMap document
file (.mxd) all data frames share the same layout. This causes
the difficulty of when the layout view is activated all of the
data frames in the document file appear in the layout, which for
some applications is not what the user wants. The Print Data Frame
command will print the active data frame, from data or layout
view, ensuring that: (a) the desired map scale is preserved, and
(b) all other data frames do not appear on the plot. This is achieved
by programmatically positioning all data frames, other than the
active data frame, in the document file outside of the user specified
sheet limits (Paper Size parameters). In so doing, when the layout
view is activated the only data frame that appears in the layout
view is the active data frame.
This capability allows the user to have a single document file
that contains many data frames with each data frame containing
a complete drawing sheet. Without the Print Data Frame command
the user would have to: (a) create separate document files for
each drawing sheet or (b) manually reposition all data frames,
other than the active data frame, outside of the sheet limits.
|
|
|
|
|
|
In addition, users have the ability to operate in another mode
of map preparation. The first mode, which was described above,
is when a single data frame contains the entire map to be printed.
The second mode is where one data frame contains the map contents,
while another data frame contains the map border (title block,
sheet border, etc.).
The Print Data Frame command accommodates this scenario by providing
the Include Data Frame matching the Paper Size option.
When this option is checked the Print Data Frame command will
position the active data frame according to the specifications
in the Data Frame Size and Position parameters area and will include
in the plot the data frame whose name is either 11"x17",
24"x36" or Custom, depending upon which Paper Size is
active. This approach enables the user to create a single map
border, placing it in a data frame using one of the following;
11"x17", 24"x36" or Custom
as the name of the data frame, and generate multiple maps without
having to load the map border into multiple data frames.
DXF Export Capability for ArcView GIS and ArcGIS
ArcView® GIS and ArcGIS® users have the ability to create a DXF file, from within ArcView 3.x or ArcMap, for all visible features in the current map. Unlike other DXF export utilities, which process only one theme at a time, the CEDRA DxfExportTM extension processes all visible themes (shapefiles, personal geodatabases, enterprise geodatabases and coverages) in the current map. In addition, the CEDRA DxfExport utility will process annotation features and graphic text elements. As such, a DXF file created by this utility can include features and text. In processing the visible layers in the map:
- If a theme has selected features then only the selected features will be processed, if there are no selected features then all features in the theme will be processed, this includes point, polyline and polygon features. If the option Export Features displayed in the Current Extent is selected then all visible features in the current view will be exported regardless of the feature's selection state.
- If a theme has labels, the labels will need to be converted into annotation, using the Convert Labels to Annotation... command, in order for the labels to be exported. The labels that are converted can be stored either in a personal geodatabase or in the map, depending upon the user's preference.
- If there are selected MARKER, PEN, FILL and/or TEXT graphic
elements then these graphic elements will be processed (if the
user desires). If the view does not contain any selected graphic
elements then no graphic elements will be processed. In exporting
graphic elements note the following:
- All of the selected Marker elements will be placed in a layer called GrapMrkr,
- All of the selected Pen elements will be placed in a layer called GrapPen,
- All of the selected Fill elements will be placed in a layer called GrapFill, and
- All of the selected Graphic Text elements will be placed in a layer called GrapText.
- The name of the theme will serve as the name of a layer in the DXF file.
- Non-alphanumeric characters in a theme name are converted to the underscore character (_).
- The user has the ability to select one or more attributes, from a choice box that appears in the Create DXF File dialog box, for inclusion in the DXF file, if desired. When exporting attributes, the selected attributes will appear as "blocks" in the DXF file. These blocks will appear at the midpoint of the feature and the name of the block will be B_xxxx, where xxxx denotes the name of the layer the feature resides in. All of the attributes associated with the block will be listed vertically, one under the other. The ability to export attributes is important because: (a) it enables the user to transfer non-graphic information (attributes) into the DXF file, maintaining the association of the non-graphic information with the feature and (b) provides a mechanism for the user to maintain symbology and line styles. Regarding the latter, symbology and line styles, in the GIS classifications are based upon attributes, by exporting the attributes which the classifications are based upon, the user has the ability to regenerate the classifications in the system in which the DXF file is being read into. This, of course, is dependent upon the software which is reading the DXF file, that it has the ability to change symbology and line style using information that is stored in a "block".
| ArcMap - CEDRA-DxfExport Dialog Box |
 |
As can be seen by examining the dialog box above, the user is able to:
- Control the name of the DXF file that is created. The Browse... button enables the user to use a standard file navigation dialog box to control the folder where the DXF file will be written to, as well as the name of the DXF file.
- Specify whether the theme names are to be trimmed to 8 characters or not. If a check appears in the square to the left of this parameter, the names of the visible themes that are processed will be trimmed to a maximum of 8 characters. The first 8 characters of the theme name will be used.
- Specify whether selected graphic elements are to be included in the DXF file creation. If a check appears in the square to the left of this parameter any graphic elements that are selected will be included in the creation of the DXF file.
- Specify whether a DXF file for importing into the CEDRA I-series software is to be created or not.
- Specify which attributes if any are to be included in the DXF file as "blocks". If a check appears in the square to the left of this parameter all attributes which are selected in the choice box will be included in the DXF file as "blocks". There is no limit to the number of attributes that can be selected, and
- Specify whether the visible features in the current extent (view) are to be processed. If a check appears in the square to the left of this parameter then the only features that will be exported will be the visible features in the current extent, regardless of their selection state. In addition, if the Export Selected Graphics (Marker, Pen, Fill and Text) option is selected, all Marker, Pen, Fill and Graphic Text elements in the visible annotation group layers which are within the current extent will be exported, regardless of their selection state. The name of the annotation group layer will serve as the name of the layer these graphic elements are placed in.
- Specify whether the data that is exported is to appear in the same coordinate system as the current view (data frame) or not. If this option is not checked, the data that is exported will be in the coordinate system of the theme's (layer's) source data. If this option is checked, all data that is exported will be in the same coordinate system as currently displayed in the data frame.
- Specify whether features are to be clipped to the current map display extent when exporting from Data View. If this option is not checked, if any portion of a feature falls within the current map display extent, the entire feature will be exported. If this option is checked, the feature will be clipped to the current map display extent prior to exporting.
- Specify whether polyline and polygon features are to be exported as LWPolyline AutoCAD entities. If this option is checked, all polyline and polygon features will be exported as a LWPolyline entity, rather than a Polyline or Polygon entity. If a polyline forms a closed figure then a closed LWPolyline entity will be exported.
ArcView 3.x Tools for ArcGIS
ArcGIS users who have worked with ArcView GIS will notice that the commands shown below: (a) do not operate the same in ArcMap as they did in ArcView or (b) are just not a part of core ArcGIS. These commands did not provide GIS functionality but they were an essential part of how ArcView GIS users operated in the ArcView 3.x environment. To ease the transition to ArcGIS, CEDRA's ArcGIS based software includes the CEDRA-ArcView3 Tools toolbar. This toolbar enables ArcGIS users to interact with ArcMap in a manner similar to how ArcView GIS users operated in the ArcView 3.x environment. For users who have never worked with ArcView GIS, these tools provide an easier and more flexible means of interacting with the map.
| CEDRA-ArcView3 Tools toolbar |

|
Functionality offered in the CEDRA-ArcView3 Tools toolbar
- Identify features from the active layers in the Table of Contents.
- Select features from the active layers in the Table of Contents.
- De-select or clear the selected features from the active layers in the Table of Contents.
- Zoom to the extent of all layers in the Table of Contents.
- Zoom to the extent of the active layers in the Table of Contents.
- Zoom to the extent of the selected features in the active layers in the Table of Contents.
- Make all layers in the Table of Contents visible.
- Make all layers in the Table of Contents invisible.
- Delete the selected features in the map with a single click eliminating the need to (a) start the Editor, (b) select the appropriate dataset and (c) select the delete command.
- Delete a group of vertices in a selected polyline or polygon feature by defining a rectangle that encloses the vertices to be deleted.
- Open the attribute table for the selected layer(s) and/or table(s).
- Switch or reverse the selection set for the selected layer(s) and/or table(s).
- Set the current active layer (Target Layer) by picking the desired layer from an alphabetically sorted list of layer names and clicking the OK button.
Click on this link for a paper describing the application of CEDRA-AVland. Adobe Acrobat® ReaderTM can be used to view and/or print the article.
To download a color brochure, which can be viewed and/or printed with Adobe Acrobat® ReaderTM, click on the following link CEDRA Software Information.
CEDRA-AVland is licensed as per the terms of the CEDRA Software License Agreement.